
 Contact Us
A simple Gaussian beam example showing when Physical Optics Propagation (POP) in Zemax OpticStudio becomes necessary and why diffraction changes what happens at focus.
It is important to remember that, at one point in history, lens designers spent weeks ray tracing and analyzing relatively simple optical systems by hand. That tedious exercise can now be completed in minutes using tools such as Ansys Zemax OpticStudio. Ray tracing remains one of the most powerful tools in optical design, but it has an important limitation: rays do not capture diffraction. The geometric ray model describes the paths light follows through an optical system, allowing us to evaluate aberrations, focus, and image formation. However, there is another fundamental source of blur in optical systems—diffraction—which only appears when we acknowledge that light also behaves as a wave.
For many imaging systems, a ray-based approach works extremely well. Laser beam propagation, however, can require a wave-based description. Near focus, a real Gaussian beam does not collapse to an infinitely small point. Instead, it reaches a finite beam waist and then begins to expand again due to diffraction. In this beginner-friendly Zemax OpticStudio example, we will compare a simple geometric ray trace with Physical Optics Propagation (POP) to see where the two predictions diverge and learn how to recognize when POP is the more appropriate analysis tool.
Calculating the Gaussian Beam Size at Focus
Before building the Lens Data Editor in OpticStudio, and running POP, we can calculate what we expect the Gaussian beam to do at focus. This gives us a simple analytical result that we can later compare directly with the POP calculation.
For this example, a diffraction-limited Gaussian beam is incident on an ideal lens with:
- Wavelength: λ = 1.064 um
- Gaussian beam radius at the lens: ωL = 1.0 mm
- Lens focal length: f = 50 mm
- Beam Quality: M2 = 1.0
The Gaussian beam radius, w, is defined at the 1/e2 irradiance point. Therefore, a 1 mm beam radius corresponds to a characteristic Gaussian beam diameter of 2 mm.
For an idea Gaussian beam focused by a thin lens, the beam radius at the back focal plane is:
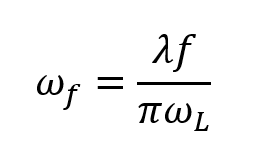
First, convert the wavelength to millimeters:

Substituting the values from our model:
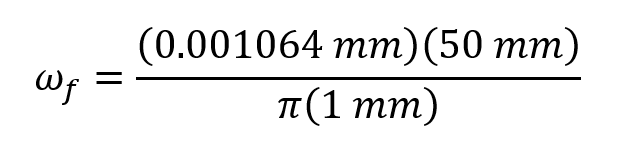
Therefore:

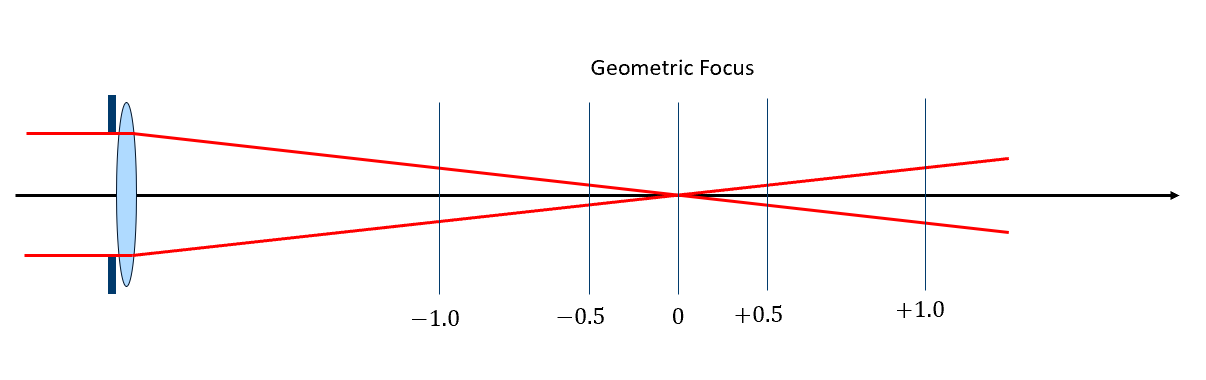
This result already highlights the limitation of the geometric model. An ideal ray trace sends every ray through the same focal point and can therefore predict a geometric spot size approaching zero. The Gaussian beam cannot do this. Even with a perfect, aberration free lens, diffraction produces a finite beam radius of approximately 16.9 um.
The Gaussian spot is NOT an optical aberration or an error in the lens design – it is a fundamental consequence of the wave nature of light. In the next step, we can use OpticStudio’s Physical Optics Propagation analysis (POP) to determine whether the stimulated field reproduces this predicted diffraction-limited focus.
Use Zemax OpticStudio’s Physical Optics Propagation analysis (POP) to determine whether the stimulated field reproduces this predicted diffraction-limited focus.
| Model | Radius at Focal Point |
| Geometric Focus | 0.00 mm |
| Gaussian Focus | 0.01693 mm |
Table showing the diffraction Blur compared to a Geometric Blur at the focus of an Ideal Thin Lens.
- Open a new OpticStudio File and set-up the System Explorer with the following settings.
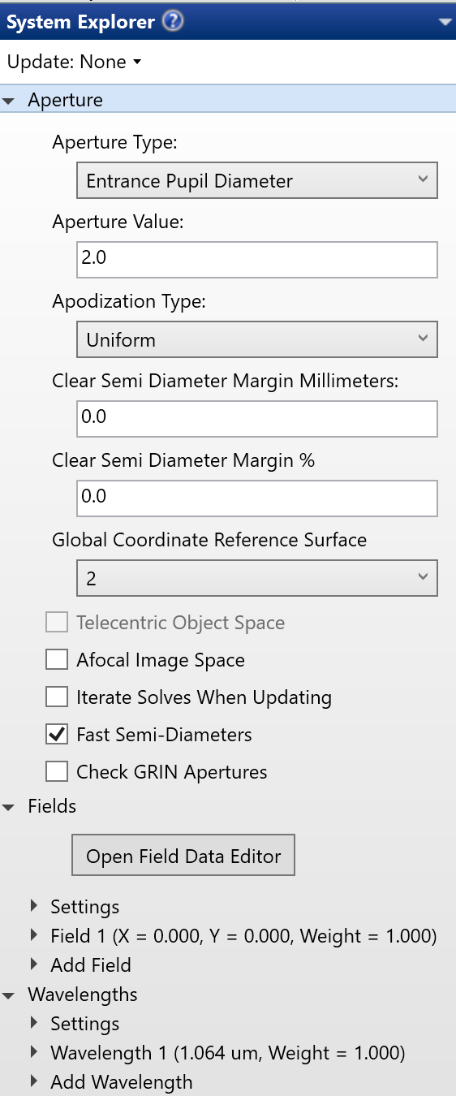
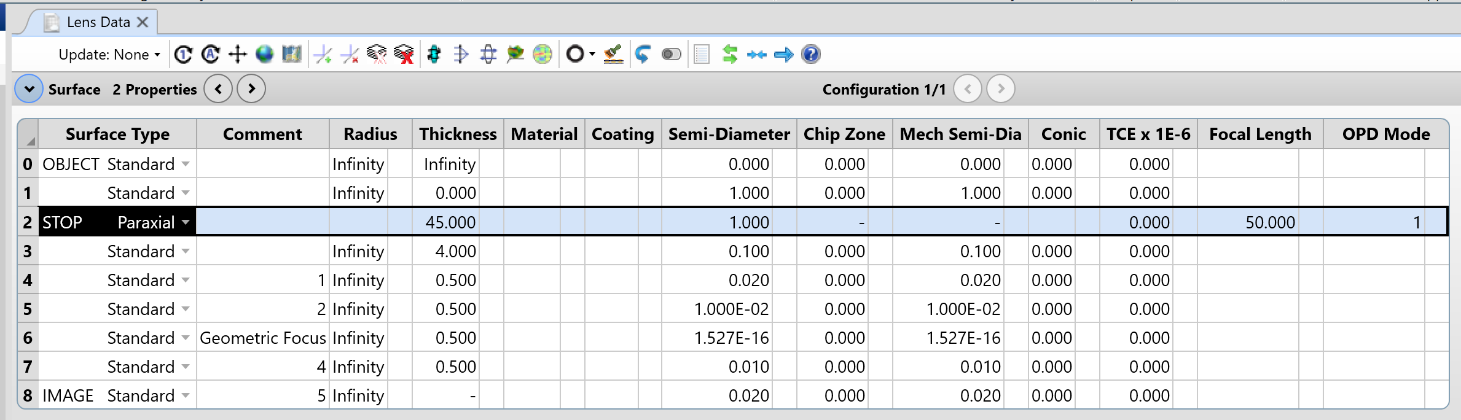
Set-up the Lens Data Editor in Sequential Mode.
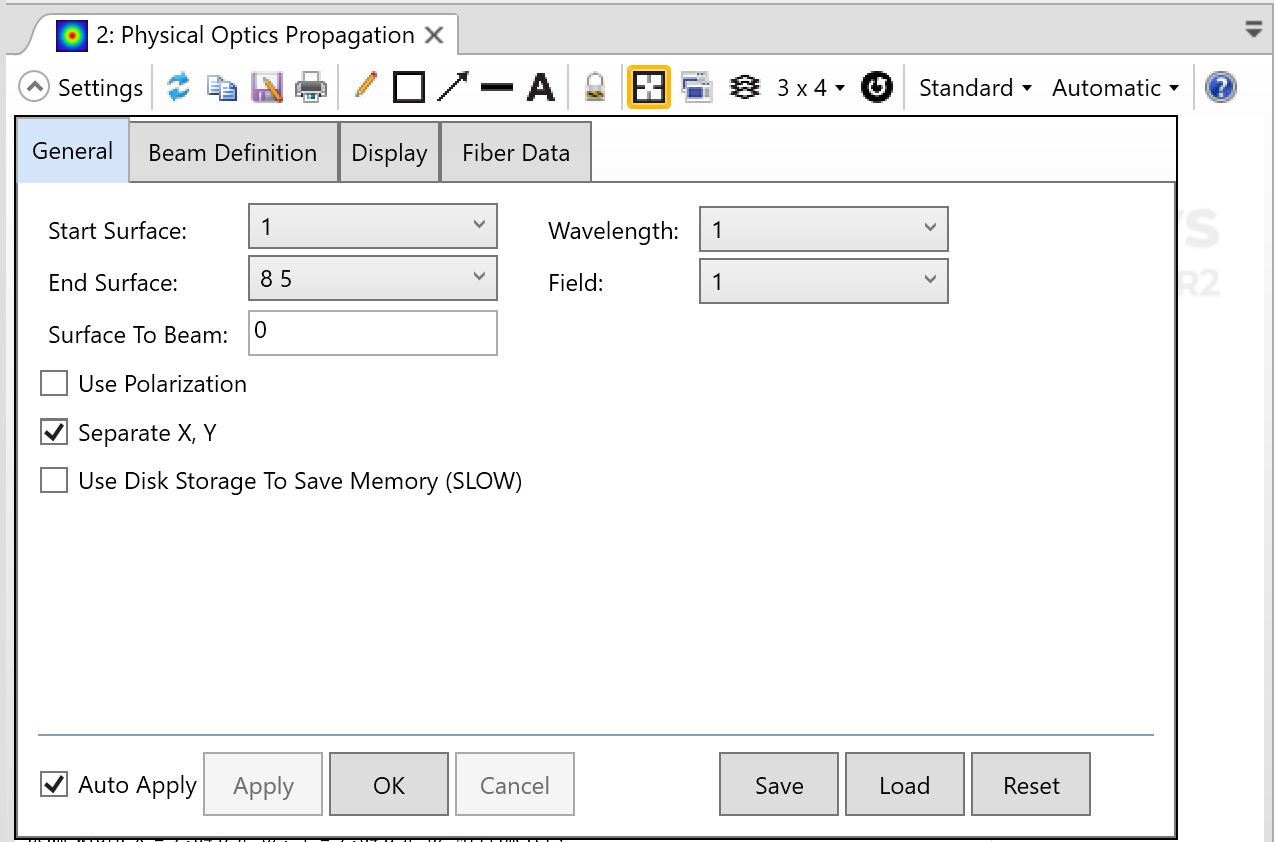
- Set-up POP Analysis.
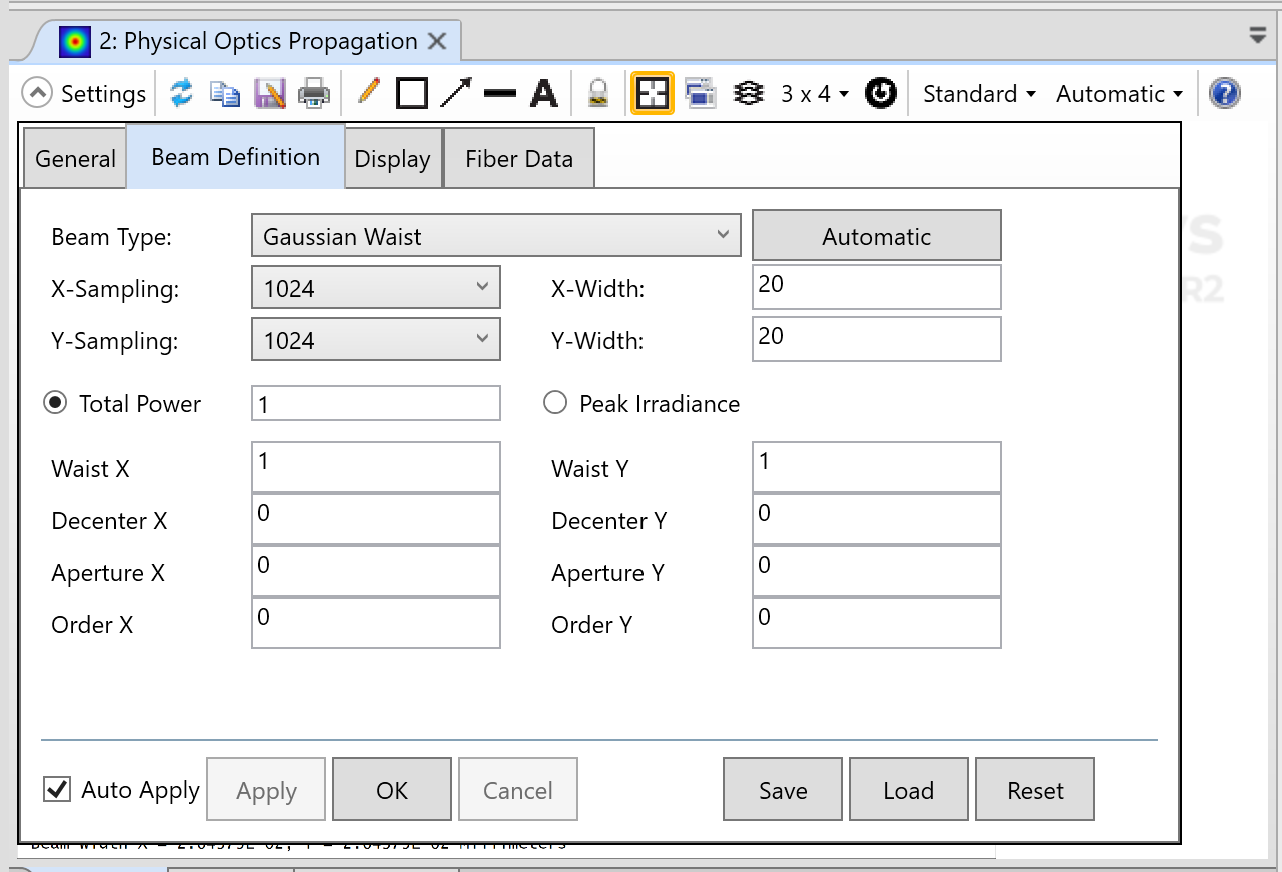
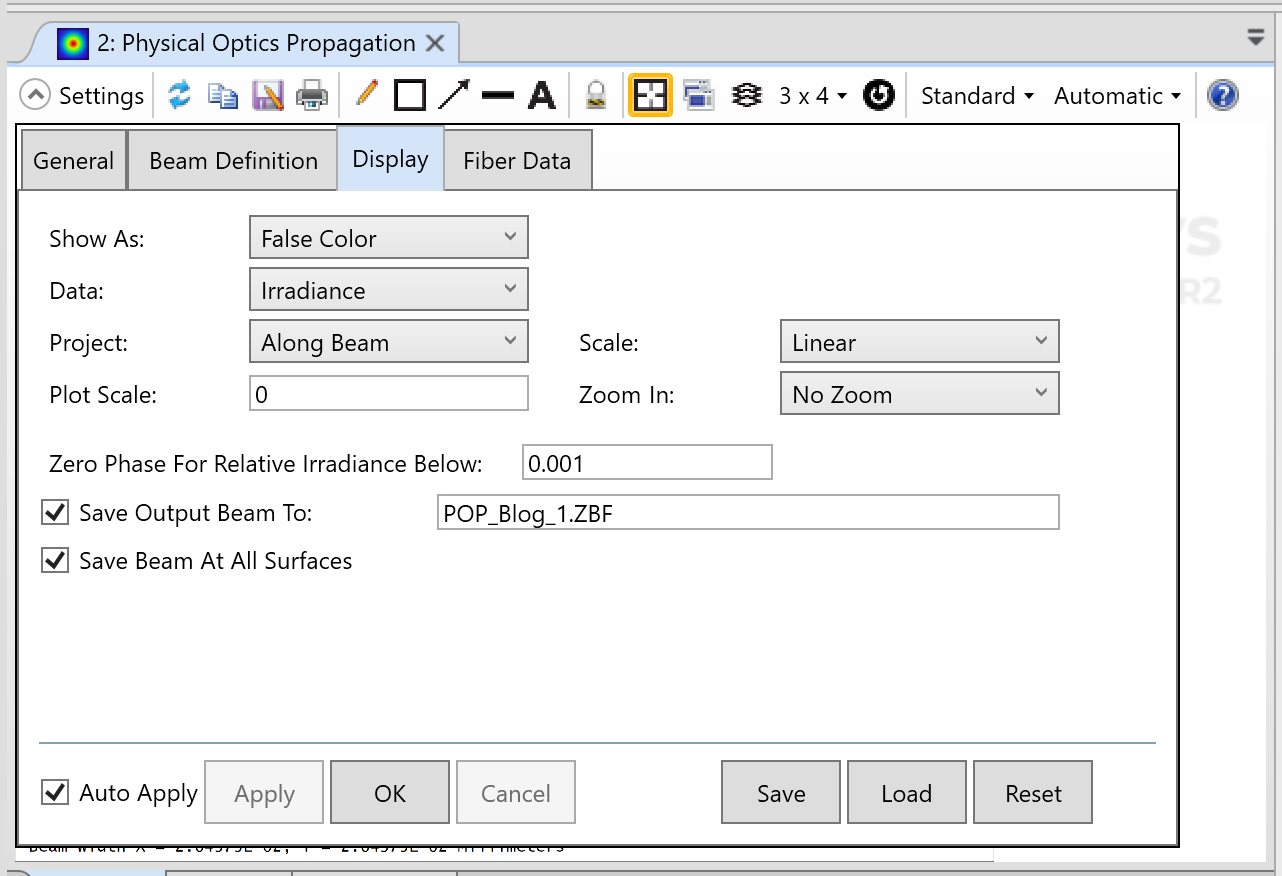
- We are going to Resample after Refraction surface by surface so we can directly compare the Results with the Through Focus Spot Diagram.
Do this for surfaces 4 – 8.
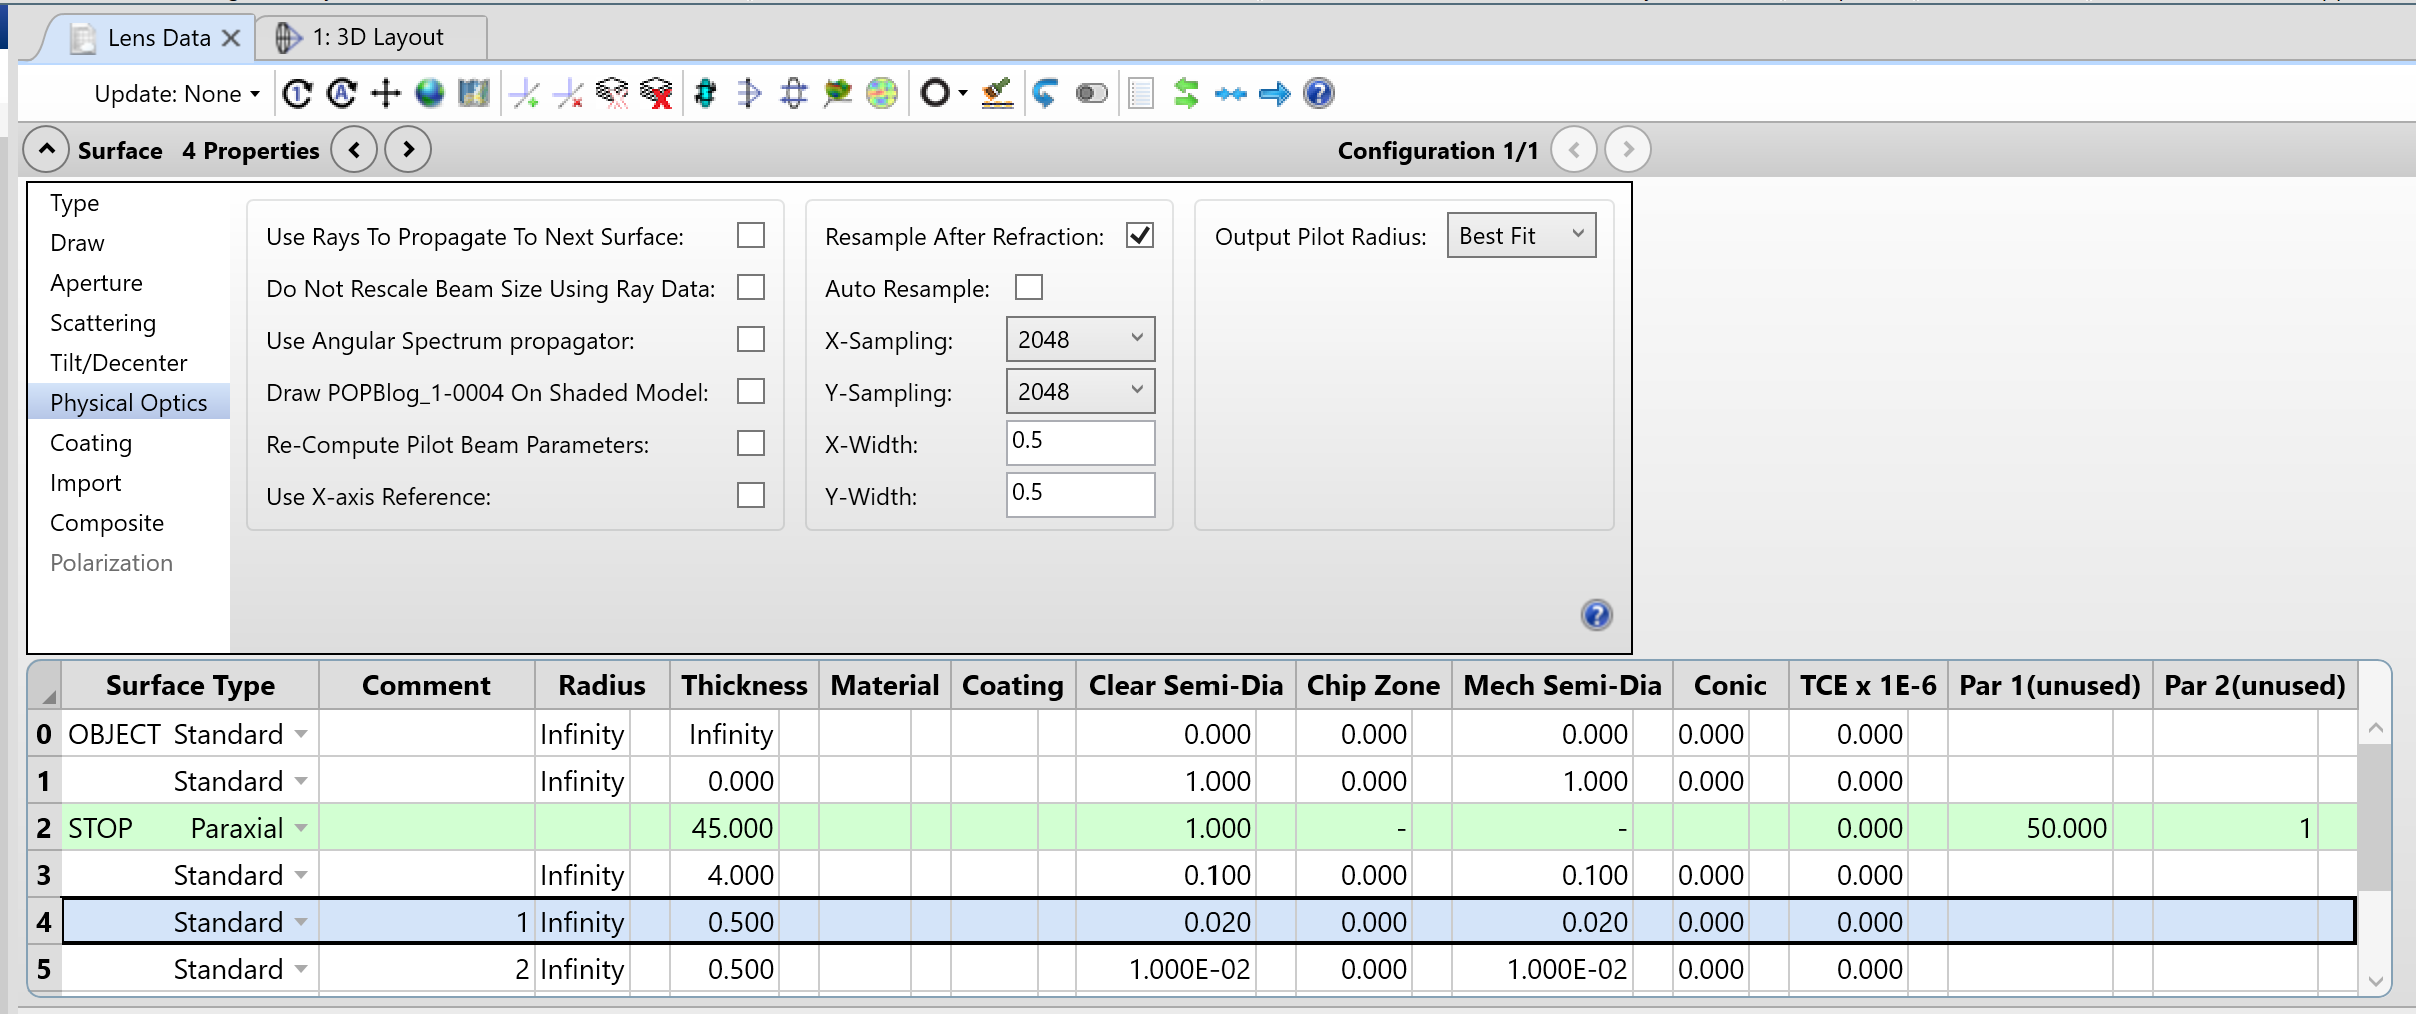
X- Y- Width at 0.5 mm is sufficient for this to show the through focus without producing aliasing effects. Any smaller the beam will start to gather weird numerical artifacts.
The Window size of the Through focus spot diagram is 0.1 mm. Below Ill show what the beam would look like if we used 0.1 mm for X- Y-Width in the Surface POP properties.
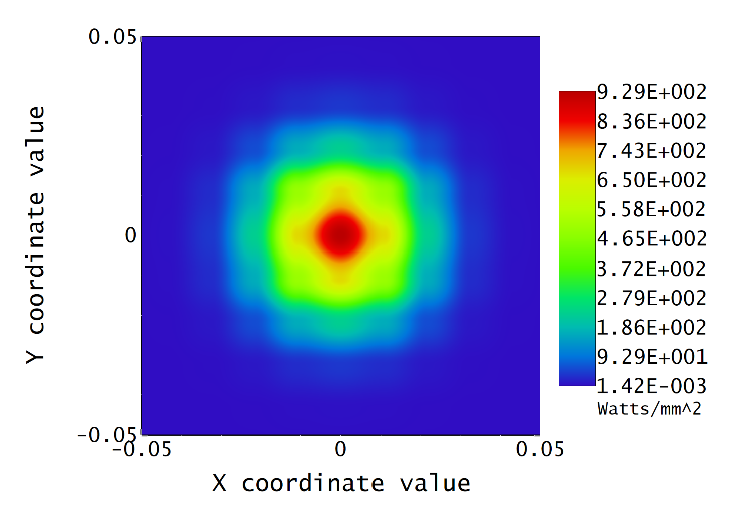
IF YOUR BEAM LOOKS LIKE THE DEPICTION ABOVE, YOUR WINDOW SIZE IS TOO SMALL AND THE ARRAY IS ALIASING. THESE ARE NOT DIFFRACTION EFFECTS.
Zemax POP Analysis Results
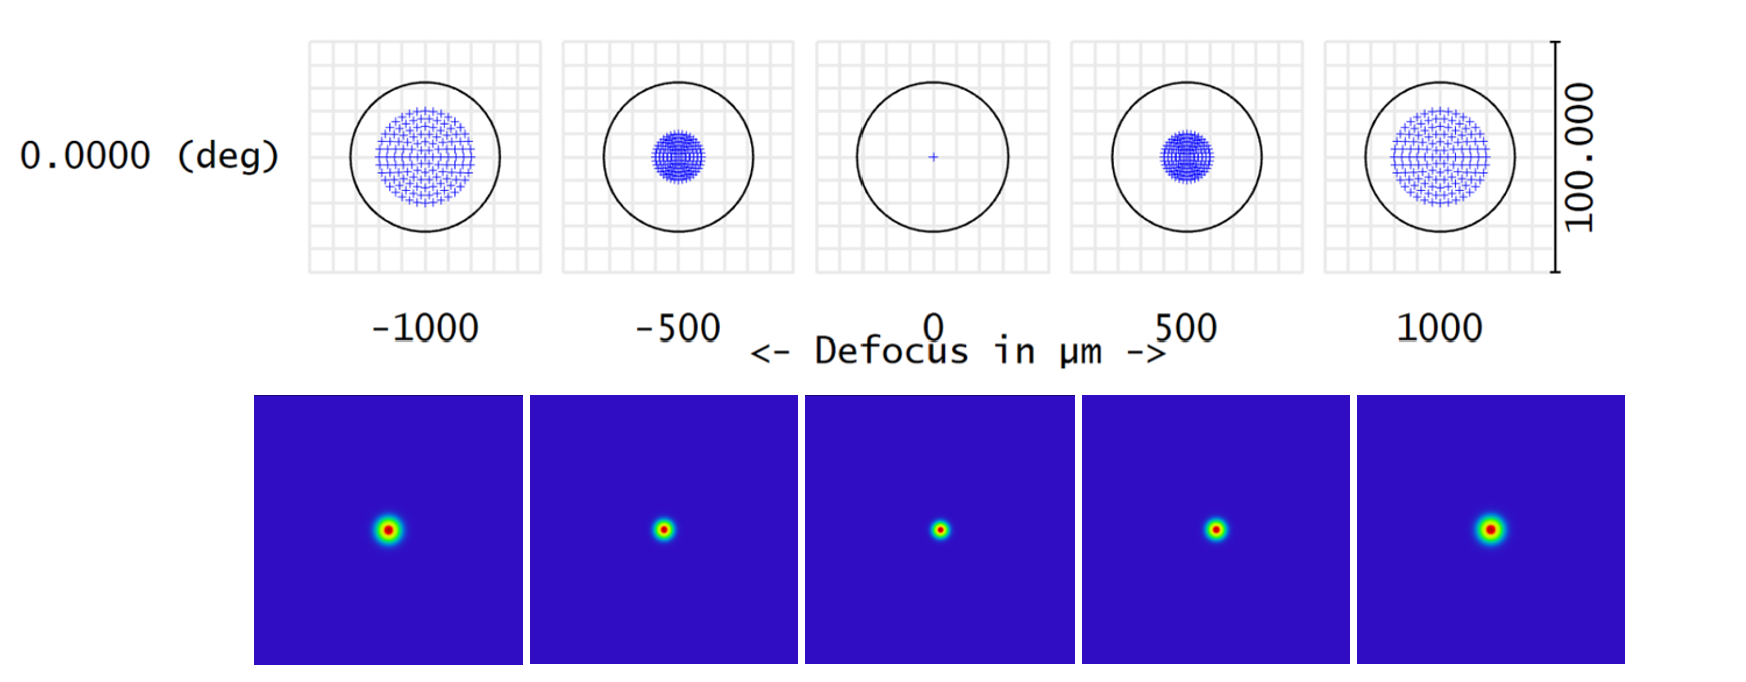
| Model | -1 mm | -0.5 mm | Geometric Focus | +0.5 mm | +1 mm |
| Geometric Width | 20.0 um | 10.0 um | 0.00 | 10.0 um | 20.0 um |
| Gaussian Width | 25.99 um | 19.579 um | 17.559 um | 19.812 um | 26.438 um |
Why Does POP Report 17.5 µm Instead of 16.9 µm?
Our analytical calculation predicted an ideal Gaussian waist radius of 16.93 µm.
OpticStudio agrees, reporting a Pilot Beam Waist of 16.932 µm at the Gaussian focus.
However, POP reports an actual Beam Width of 17.553 µm, about 3.7% larger.
The difference comes from what the two values represent. The Pilot Beam Waist is the ideal Gaussian reference propagated through the system, while Beam Width is calculated from the second moment of the actual sampled irradiance distribution produced by POP.
Therefore:
Ideal Gaussian prediction: 16.93 µm
POP propagated beam width: 17.55 µm
The close agreement validates the Gaussian calculation, while the small difference illustrates an important feature of POP: it evaluates the propagated optical field rather than assuming the beam remains a mathematically perfect Gaussian.
Zemax OpticStudio POP Analysis Conclusion
Ray tracing remains one of the most effective tools in optical design, but it does not describe every optical phenomenon. In this simple example, the geometric model predicted an ideal point focus, while Physical Optics Propagation predicted a finite Gaussian beam waist driven by diffraction.
The analytical Gaussian calculation predicted a focused beam radius of approximately 16.93 µm, while POP returned a beam width of approximately 17.55 µm. The close agreement confirms that the finite spot is not caused by lens aberrations—it is a consequence of the wave nature of light.
The key takeaway is simple: use ray tracing when geometric optics adequately describes the system, but use POP when diffraction, coherent propagation, Gaussian beam behavior, or field evolution through focus becomes important. Understanding where geometric optics ends and wave optics begins is what allows OpticStudio users to choose the right analysis tool for the problem.
Need Help with Laser Propagation in Zemax OpticStudio?
Accurate laser system design requires understanding when geometric ray tracing is sufficient and when diffraction and wave propagation must be considered. SimuTech Group’s optical engineers can help you model laser behavior, validate simulation results, and improve optical system performance using Ansys Zemax OpticStudio.
Explore our Optical Simulation Consulting Services to discuss your next project.

Charles Taylor
Staff Engineer – Optics, SimuTech Group
Charles J. Taylor is an Optical Engineer at SimuTech Group specializing in optical design and simulation using Ansys Zemax OpticStudio. He holds a Master of Optical Sciences from the University of Arizona, where his research examined diffraction and alignment sensitivity in segmented telescope systems. His technical expertise includes ray tracing, physical optics propagation, polarization, and laser system analysis, with a focus on helping engineers develop, evaluate, and validate optical designs.