How to Account for a Non-Zero Mean Stress in a Fatigue Analysis | Ansys Mechanical Workbench
This tips & tricks article illustrates how to take into account a non-zero mean stress in an Mechanical Workbench fatigue analysis.
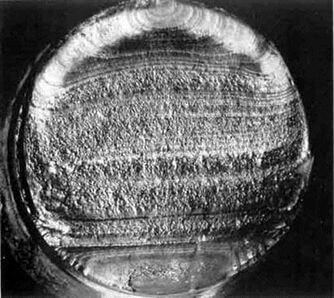
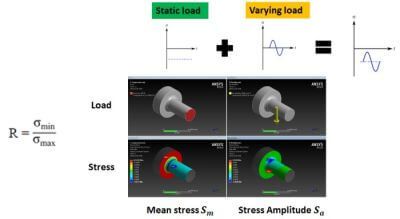
Combine static and varying load in WB Fatigue Module
ANSYS WB Fatigue Module is able to solve Constant Amplitude, Non-Proportional Loading
First here are some definitions:

Non zero mean stress loading & mean stress correction
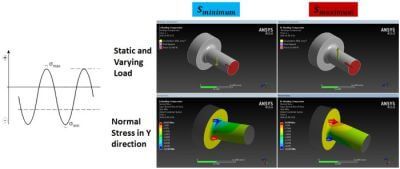
To create this fatigue analysis solution we have to obtain the stress result for Smaximum and Sminimum

Alternating bending stress R < -1
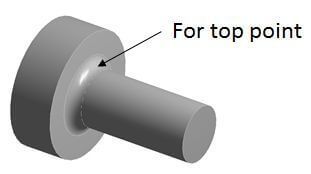
For instance we have an alternating bending stress with a mean compression stress.
Smaximum and Sminimum
In Ansys Workbench we have to combine the static and alternating stress in 2 static structural solutions that will give us the Smaximum and Sminimum.
Solution Combination
Once the maximum and minimum result is obtained we will be able to combine them into a Solution combination to allow the fatigue module calculate it.

Mechanical Workbench Module | Fatigue Analysis Result
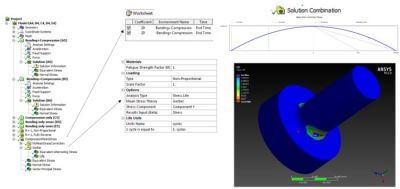
In the Gerber mean stress correction theory, the compression mean stress has a penalizing impact on the fatigue life of the part.
Fatigue Life with Alternating Stress
At stress levels below a material’s yield strength, a portion subject to alternating stress might experience fatigue failure. To create designs that protect against fatigue failure, we can apply the stress life method to fatigue analysis.
Oscillating (or alternating) stress is placed on machine parts that are subjected to cyclic loads that fluctuate over time with the same amplitude. Take a look at the stress vs. time graph below.
Oscillating Stress
The maximum and minimum stress are the same for each cycle of the stress, which is cyclic (repeats). In contrast, spectral loading has maximum and minimum stress that fluctuate over time and may even be random. Special cycle counting methods are needed for spectral loading to take shifting stress amplitude and mean stress into consideration.
The stress amplitude is stated as:
- Amplitude is equal to (max stress – min stress)/2.
The mean stress is stated as:
- Mean/average stress is equal to (maximum + minimum)/2.
The aforementioned example:
- amplitude = (10 – (22 – 2)/2)
- stress average = (22 + 2)/2 = 12
Diagram S-N
We require an S-N diagram that describes a material’s failure from fatigue for a specific number of cycles in order to use the stress life approach to fatigue analysis. The cycles to failure are represented on the x-axis, while the stress amplitude is plotted on the y-axis.
Fatigue Capacity
The material’s fatigue limit is the highest stress that it can withstand for a very large number of cycles without failing. The amount of stress that a material can sustain over an infinite number of cycles is frequently referred to as its endurance limit. For some materials, like aluminum, the fatigue limit is believed to be reached after a considerable number of cycles, like 108. In this piece, the terms “fatigue limit” and “artificial limit” are interchangeable.
Taking into account Non-Zero Mean Stress
Typically, zero mean stress results in the generation of an S-N diagram. The stress ratio in this situation is (min stress/max stress) = -1.
We can utilize the S-N diagram to compensate for mean stress if our circumstance does not have entirely reversed loading and mean stress is not zero. This is know as a Mean Stress Correction.
Once effective stress has been established, if it does not exceed the fatigue limit, it is acceptable. We use the S-N diagram to determine the number of cycles to failure at the effective stress level if effective stress exceeds the fatigue limit.
- To learn how to use Ansys Mechanical Workbench to calculate fatigue life, click HERE.


