Replicating Acceleration Movements and Onset Cueing
Ansys Mechanical APDL and Mechanical Workbench can perform base acceleration in harmonic analysis on a variety of structure types. Be it for determining the steady-state sinusoidal response to sinusoidal varying loads all acting at a specified frequency. Some load types can be applied with a phase offset.
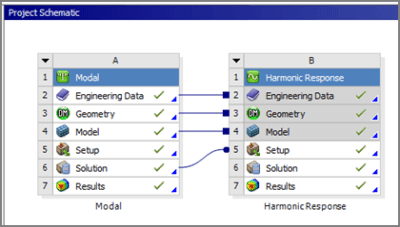
Figure 1 above shows the Ansys Workbench Project Schematic for a Harmonic analysis, and includes a Modal analysis to characterize the structure. This Harmonic analysis is not using modal superposition, as can be seen in the fact that Solution results from the Modal analysis are not linked.
Many structures are tested per customer specification with base accelerations swept across a range of frequencies. Such a test can be implied by fixing a base in Ansys, and applying an acceleration load to the whole model with an ACEL command.
The resulting movement at a point on the FEA model is relative to a fixed non-moving base, and is not what would be picked up at the point with an accelerometer. To replicate acceleration movements at a base would require an acceleration input at selected geometry, which Ansys does not directly support in Harmonic analysis.
Force Input to Harmonic Oscillator
This article illustrates conversion of an acceleration harmonic input into a displacement input, and its use in an Ansys Workbench model. Such an input should result in model movements that replicate what should be picked up by a physical accelerometer placed on the product, since they include base movement.
Loads on Harmonic Models
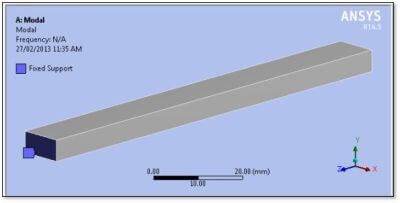
A 3D solid beam model was created with one end fixed:
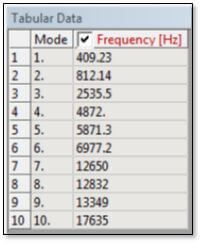
A modal analysis quickly shows the first several natural frequencies of vibration of this model:
One-dimensional Motion Direction with nonzero Displacement
The same geometry and mesh are used in a Harmonic analysis in Workbench. The harmonic load is applied at the fixed end of the beam with X and Z movements fixed, but a UY harmonic displacement applied. An APDL test will show that although the Ansys command D for a non-zero displacement can support velocity or acceleration input in some structural analyses, these inputs are not supported in a Harmonic analysis:
*** ERROR *** CP = 2.824 TIME= 08:58:19
Velocity or acceleration boundary conditions in a harmonic analysis or
a prestressed harmonic analysis is not supported.
A non-zero displacement load can be applied in a Harmonic analysis. When a specification calls for a velocity or acceleration load to be applied to selected geometry in a harmonic vibration test, Ansys commands can convert the specified velocity or acceleration load into a displacement load and apply it to the geometry with a Table Array as a function of frequency.
Harmonic excitation velocity is harmonic displacement multiplied by angular frequency ω, which is 2π multiplied by frequency f, and phase shifted by 90 degrees, which in complex notation means multiplied by i. Acceleration is velocity multiplied by ω and phase shifted another 90 degrees, so multiplied by another i.
- d = displacement
- v = velocity
- a = acceleration
- f = frequency
- ω = 2πf
- v = iωd
- a = -ω2d
Conversion from a specified harmonic acceleration a to a non-zero displacement amplitude d means forming:
d = -a/ω2 = -a/(2πf)2
When a specification calls for an acceleration to be applied to a base or other selected geometry on a structure, it can be converted to an applied non-zero displacement as a function of frequency in this manner.
In the present example, a constant acceleration value is to be applied across a range of frequencies. A Table Array can be used in Ansys to achieve this. To apply a non-zero harmonic displacement requires Full harmonic analysis. The following APDL Commands Object at the Environment level applies such a load to nodes in the Named Selection (component) called End_Face. In this example, a constant acceleration of 10 mm/sec2 is converted to displacement as a function of frequency.
A frequency range of 5 to 1000 Hz is used for illustration:
! Acceleration Input in Y on nodes of component “End_Face”
cmsel,s,End_Face ! nodes on Named Selection “End_Face”
myaccel=10
points=200 ! more points for better accuracy
start_freq=5
end_freq=1000
twopi=2*acos(-1) ! must be radians
stepsize=(end_freq-start_freq)/(points-1)
*dim,my_uy,table,points,,,TIMEn ! TIME implies frequency
*do,ii,1,points
freq=start_freq+stepsize*(ii-1) ! frequency
my_uy(ii,0)=freq
omegasq=(twopi*freq)**2
my_uy(ii,1)=-myaccel/omegasq ! amplitude
*enddo
!
d,all,uy,%my_uy% ! apply UY as function of frequency
allsel
Harmonic Analysis Frequency Ranges
The frequency range in the APDL code above must span or exceed the range of frequencies to be employed in a sweep of harmonic analysis frequencies. The Table Array method used here will apply displacement amplitudes as a function of frequency during the SOLVE of the model. It is assumed here that there is no phase shift in the applied acceleration. Note the implied 180 degree phase shift in the minus sign on the displacement value.
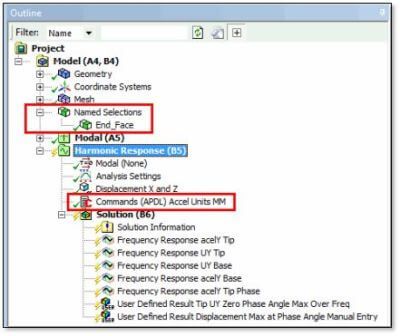
The Outline for the example shows the Named Selection used in the above APDL code, and the placement of the APDL code in the Harmonic Response environment. Since the above APDL places a non-zero displacement in the UY direction on the face that is fixed in the modal analysis, other objects constrain the face movement in X and Z:
In the event that a specification called for harmonic acceleration input that is not constant with respect to frequency, the APDL coding could be adjusted to use the acceleration value in the line:
my_uy(ii,1)=-myaccel/omegasq ! displacement
as a function of frequency. As an example, if the acceleration was to satisfy this table:
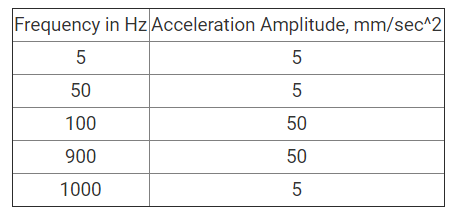
The APDL code might represent the acceleration value with at Table Array:
*dim,myaccel,table,5,1
myaccel(1,0)=5,50,100,900,1000 ! Frequencies in cycles per second
myaccel(1,1)=5,5,50,50,5 ! Acceleration amplitudes
The displacement line in the above coding would be modified to look up the input acceleration:
my_uy(ii,1)=-myaccel(freq)/omegasq
Outputs from the Example Mode
When the input acceleration is a function of frequency, as just above, then the Frequency Response where the load is applied can be traced in the Solution output. For the above variable acceleration example, a plot shows:
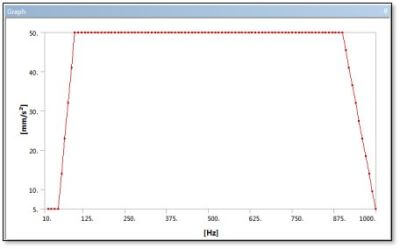
As desired, the above figure response plot of acceleration in Y matches the data entered with the lines:
myaccel(1,0)=5,50,100,900,1000
myaccel(1,1)=5,5,50,50,5
Although Ansys and Workbench cannot take an applied velocity or acceleration as a harmonic displacement input at nodes, Workbench can plot the acceleration frequency response, which can be used to verify that the desired acceleration loading was applied via the displacement table array method.
In the above example, the frequency sweep passes through a resonance with motion in the UY direction, as can be seen in these frequency response plots of tip UY displacement and UY acceleration:
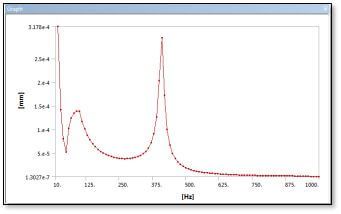
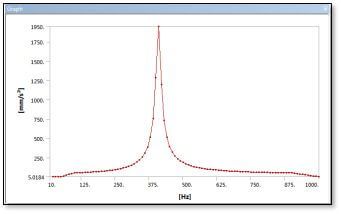
The damping in this example is only 2%, so to resolve the sharp peak in the response would require a finer density of frequency sampling points than was used here.
Conclusions | Base Acceleration in Harmonic Analysis
Specifications sometimes call for products to be subject to harmonic acceleration loading applied to the base of the product. If absolute accelerations are to be measured at points on the product, a harmonic finite element analysis would be best run with non-zero acceleration inputs at a base. Ansys supports only non-zero displacement loading at nodes in harmonic models. The desired non-zero harmonic acceleration loading can be converted to displacement as a function of frequency, and the desired load applied in Ansys via a Table Array that is a function of frequency (referred to as TIME in the table array).
APDL coding can apply the desired loading on faces indicated via Named Selections in an Ansys Workbench analysis.
Frequency response plots at the base where the loads are applied can be used to confirm that the desired displacement and acceleration loads were input. Frequency response plots at other points in the model can show the absolute (relative to the global origin, not relative to the base) displacement and acceleration results elsewhere in the model.
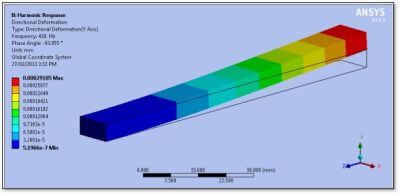
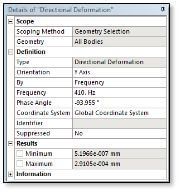
The usual displacement, stress and strain plots can be generated. Users should note that chosen frequencies and phase angles must be manually entered in many of the results plot object details. In the use of APDL commands as illustrated above, the correct units must be used in the accelerations and displacements, and these units must be employed in the SOLVE of the Workbench model.
Additional Ansys Software Tips & Tricks Resources
- For guidance on Pre-Stressed Modal Analysis Linked to Nonlinear Static Analysis
- For support on Compiling and Loading User Defined Functions (UDFs)
- For Extreme Thermal Expansion Modeling in Mechanical
- For enhancing Autonomous Vehicle Hazard Recognition
- For advanced Analysis of Models Exhibiting Cyclic Symmetry
- Deploying *TREAD in Mechanical APDL to Read External Data


