Frequency In Induction Heating Applications
As induction heating utilizes alternating currents and magnetic fields for heating, the choice of frequency will play an important role in the process. Induction heating frequency optimization allows us to control heat distribution, improve energy efficiency, and achieve precise heating outcomes for various applications.
In the induction heating industry, most applications are in 100Hz – 1MHz range. There are applications at line frequency and ones in the high megahertz ranges, but those are not as common and have their considerations. At high frequencies (e.g. 13.56 MHz), regulations and high voltages need to be considered.
Key Considerations for Induction Heating Frequency Optimization
There are several frequency-dependent phenomena that strongly affect the heating behavior that must be considered. Furthermore, the power supplies used for induction heating applications have set frequency ranges, so knowing the optimal frequency is crucial for power supply selection.
In this post we will show how frequency affects the skin, edge, and end effects. The proximity effect will be shown in some examples but will not be discussed in detail.
Skin Effect
In AC applications, the magnetic field does not penetrate conductors completely, and the currents do not flow in the entirety of the conductors’ thickness. The current flows through the volume of the conductors but concentrated at the surface. The level of current density concentration through the depth is dependent on the conductor’s electrical conductivity (inverse of resistivity), magnetic permeability, and frequency.
It is common to calculate a value commonly known as skin depth, or reference depth, often denoted δ, using the following equation:
δ=√(1/(πfσμ0μr))
Where:
- δ: Skin Depth [m]
- f: Frequency [Hz]
- σ: Electrical Conductivity [S/m]
- μ0= 4π * 10-7 H/m: Permeability of free space
- μr: Magnetic relative permeability [NA]
- *ρ: Electrical Resistivity [Ωm], σ=1/ρ, Resistivity is often used instead of conductivity
For thick conductors where δ << thickness, the current density drop in thickness can be calculated according to the following equation:
J=Jse-d⁄δ
Where:
- J: Current density [A/m2]
- Js: Surface current density [A/m2]
- d: Depth [m]
The heat load can also be calculated from the current density using the following equation:
Pv=J2/σ
Where:
- Pv: Power density [W/m3]
From the previous equations we can see that the skin depth depends on the conductivity, permeability, and frequency. Conductivity and permeability are material properties, and in most cases can’t be changed, leaving frequency as the main variable. (Note: conductivity and permeability are temperature dependent, and permeability can be non-linearly dependent on the field, making the equation below more comprehensive.)
δ=√(1/(πfσ(T)μ0μr (T,H)))
Where:
- T: Temperature
- H: Magnetic Field Strength [A/m], μ=μ0μr=B/H
- B: Magnetic Flux Density [T]
Additionally, we can tell at a depth of 1δ, the current density is ~37% of the surface current density and power density is ~13.5% of the surface power density. This means nearly all the power is within 1 skin depth of the surface.
Skin Depth Simulations
A set of simulations in Ansys Maxwell were made to show how the skin effect looks in workpieces. 2D axi-symmetric induction heating simulation of a cylindrical workpiece. The simulations varied the frequency, electrical conductivity, and permeability to show their effect on the skin depth. The baseline simulation was made at 10 kHz frequency, µr = 1, and σ = 106 S/m.
The image below shows contours of normalized current and power density and the normalized current density on the center line for 1, 3, 10, 30, 100, and 400 kHz frequencies.
The image below shows contours of normalized current and power density and the normalized current density on the center line for 1, 10, 100, 1000 relative permeabilities.
The image below shows contours of normalized current and power density and the normalized current density on the center line for 102, 103, 104, 105, 106, and 107 S/m electrical conductivities.
End Effect
The end effect describes the current density behavior in the corners (axial direction) in workpieces and inductors.
In conductors, there is a current density axial spike or drop at the ends, this will result in non-uniform heating. The end effect is greater for higher frequencies. The example below shows how the end effect looks. This simulation also demonstrates the skin effect.
In this example we have an axi-symmetric heating simulation of a stainless-steel cylinder. For this simulation we have a simple, single turn coil and we have three cases at 2 kHz, 20 kHz, and 200kHz. The results show the normalized current density contours and normalized current density graphs at the outer diameter.
We can see from the results the difference in the axial distribution vs frequency leading to uneven heating along the axial direction. At the low frequency, we can see underheating of the ends. At the high frequency we can see overheating of the ends. There is a more uniform current density distribution at the middle frequency. This behavior is more pronounced for the power density since it is proportional to the square of the current density. Furthermore, uniform heat distribution does not always equate to uniform temperature distribution, as there is higher heat loss due to the top and bottom surfaces, it may be preferred to have a positive end effect. Finally, it is also common to control the end effect with the coil design by modifying its height or turn spacing.
Edge Effect
There is a phenomenon called the edge effect when current flows around a corner it is observed that the current ‘cuts’ the corner, the depth is frequency dependent. This is important to be aware of because for low frequencies, the corners will be underheated, while for high frequencies they will be overheated.
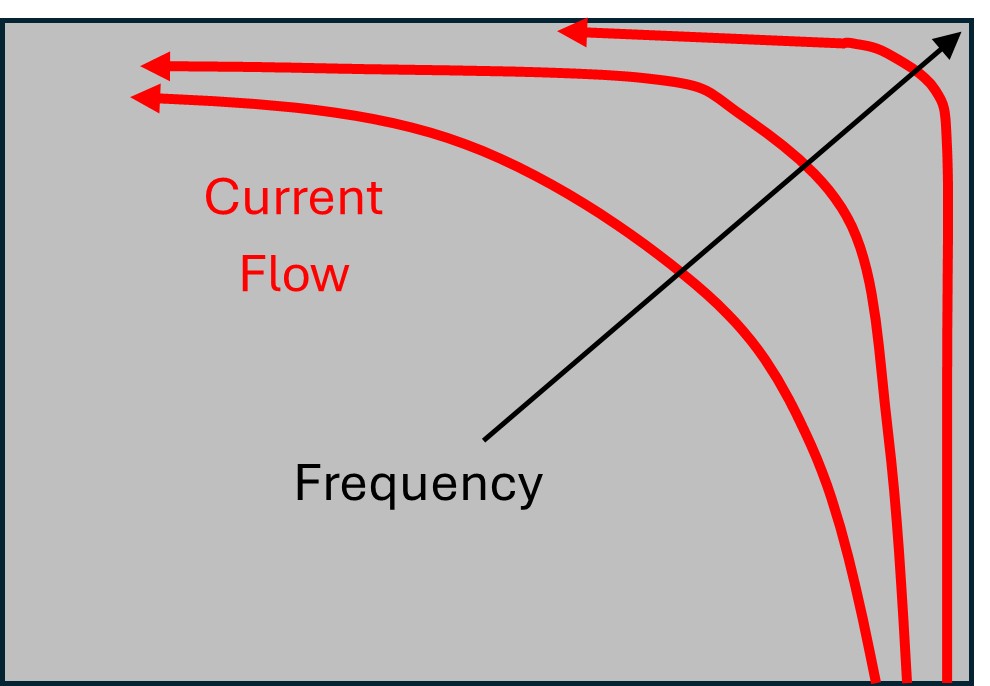
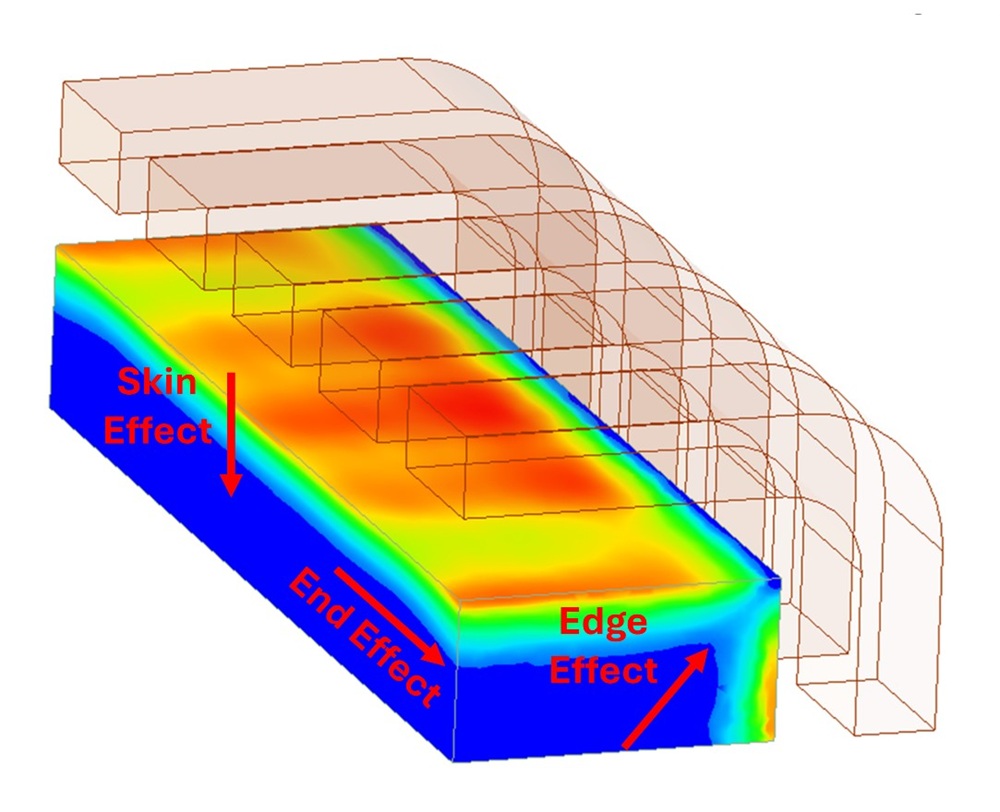
In this example we see the skin effect, the edge effect, and the end effect, as illustrated in the image below.
Real World Applications for Induction Heating Frequency Dependence
Here are examples of how understanding these effects and frequency choice matters for real induction heating applications.
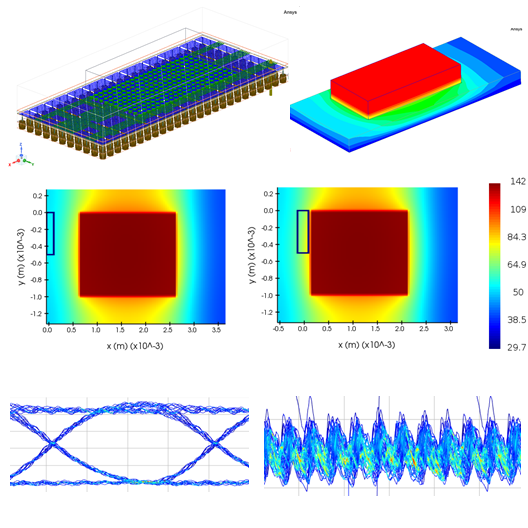
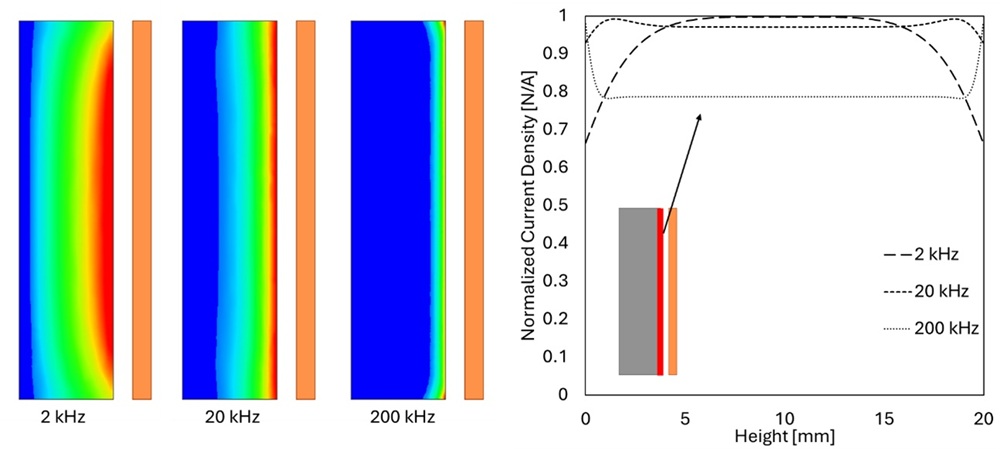
In this example we show the current density distribution in the copper. As induction heating applications require coils, this is a very typical use case. Here we show two conductors with opposite polarities, as is the case with coil leads (or bus bars), at frequencies of 2kHz, 20 kHz, and 200 kHz. We can see from the contours three different effects: the skin effect, the proximity effect, and the lead effect. In this example we will focus on the end effect.
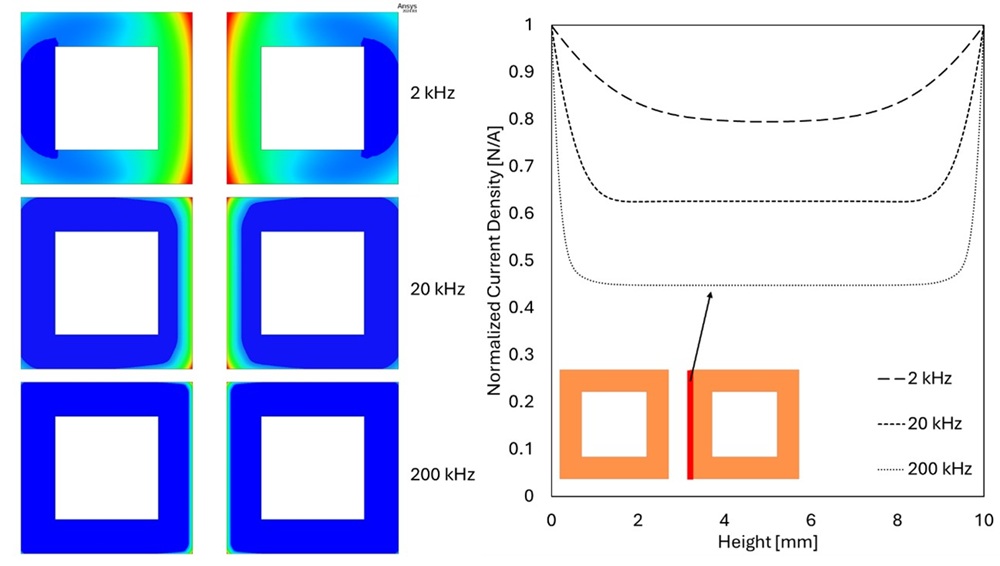
When we plot the normalized current density on the internal face, we can see a clear increase in the end effect. There is a clear spike in current density on the copper face, with an increase in intensity with frequency. This behavior is important to understand because with the increase in end effect, the power density (which is proportional to the square of the current density) becomes more highly concentrated in the corners and farther from the water-cooling surface.
Because elevated copper temperatures, temperature gradients, and thermal shock (constant on/off cycling) are common reasons for coil failures, it is important to understand the behavior and design for it.
One method that is common in the industry to mitigate these effects is to machine channels so the water-cooling interface is closer to the ‘hot’ spots. Due to proximity effects (between the coils and workpiece) and end effects, some areas in the coils have higher losses and require more cooling. The image below shows an example of a machined channel.
The image shows a machined channel at the bottom of the coil improve the cooling of the coil’s tip, which experiences higher heating due to proximity and end effects.
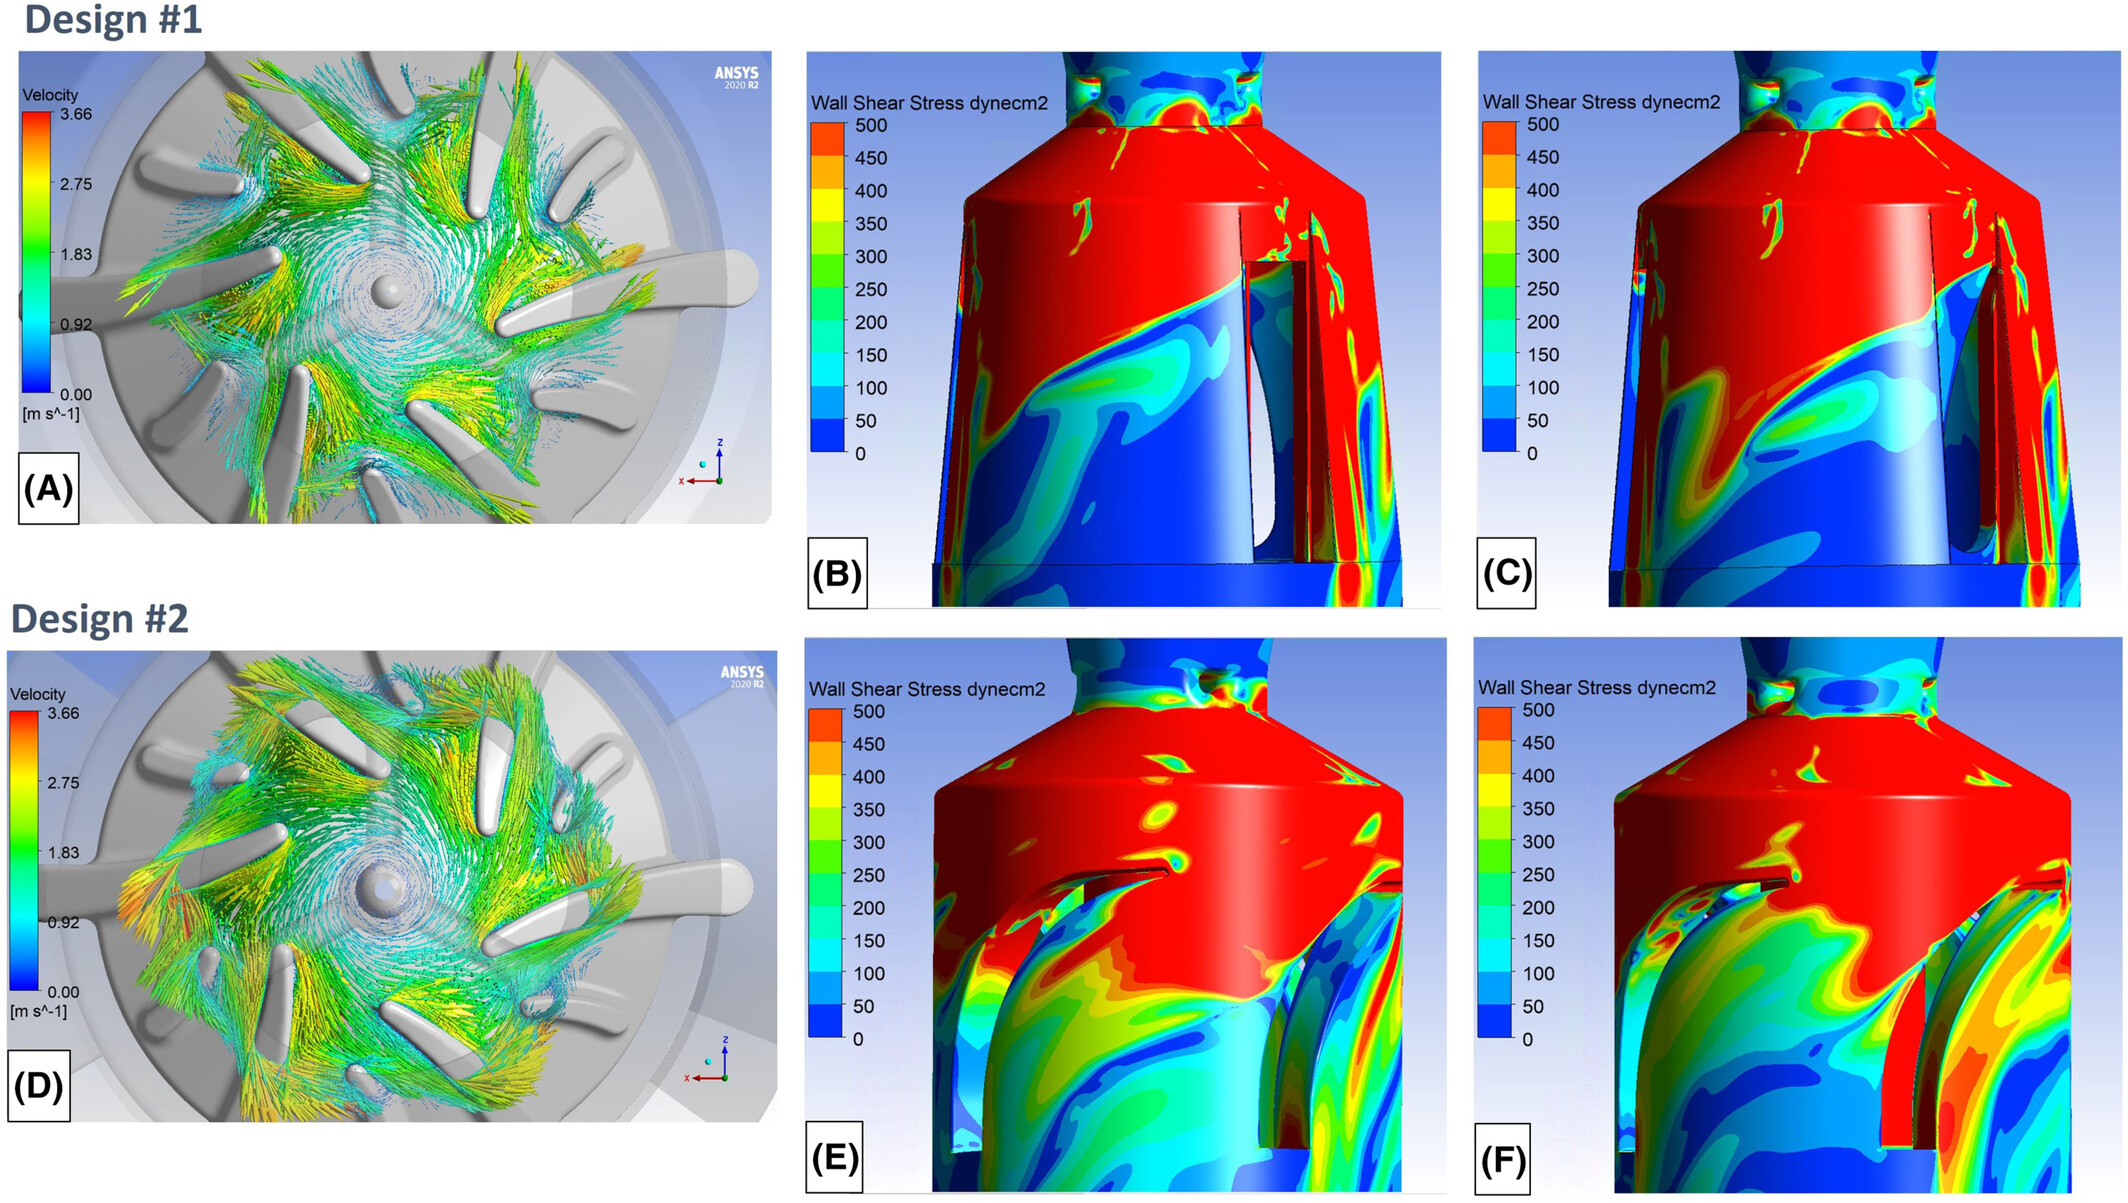
Gear hardening is vital for the manufacturing and operation of gears. Induction hardening of gears is very popular and frequency choice is very important to properly harden gears.
For low frequencies (relative to geometry and material properties) the current will cut across the teeth and overheat the roots. With high frequencies the current will flow into the teeth and overheat them relative to the roots. It is therefore important to choose the correct frequencies. It has become popular to use dual frequencies and more advanced capabilities, further proving the importance of frequency choice.
In this simple 2D example, the effect of frequency is shown for simple gear heating. The two images show results for low and high frequencies and the changing material properties.
The image above shows how symmetry planes were used to reduce the simulation size and time by only simulating half a tooth. In practice, the gears are rotated to reduce the lead effects (lower or irregular magnetic field near the coil eads).
The images above and below show a set of contours. The first contour shows the temperature during the heat cycle. The second contour shows the normalized current density distribution during the heat cycle, from which the ohmic loss was calculated. The third contour shows the electrical conductivity during the heat cycle, which is a temperature dependent material property that affects the heating of the coil. The last contour shows relative magnetic permeability during the heat cycle, which is temperature and magnetic field dependent.
We can see from the low frequency results that the current flows into the tooth at the beginning of the heat cycle (highly conductive and magnetic) but then begins to bypass the tooth as the gear heats, with the final temperature showing an underheated tooth. The high frequency results show a more pronounced skin effect and the current remains in the tooth during the heat cycle, with the final temperature showing an overheated tooth.
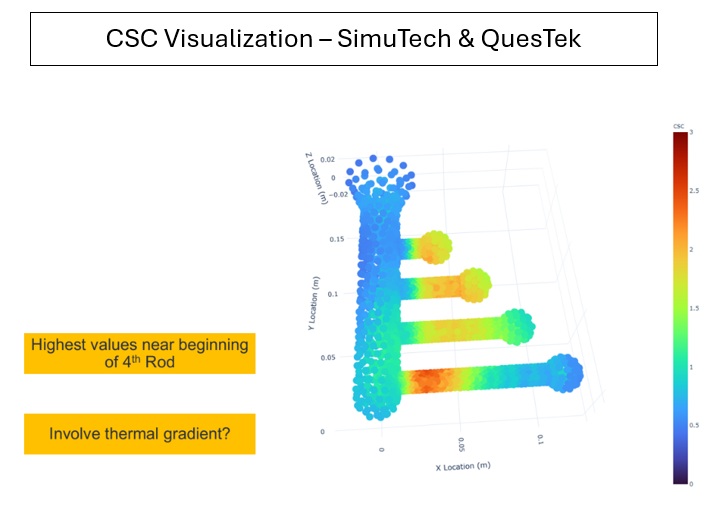
Another consideration when induction heating gears is the end effect. As improper coil designs and/or frequency choice can result in the gear having over or under heated ends. True gear heating is a highly transient 3D process requiring a 3D simulation. As with the 2D simulation shown above, we can take advantage of symmetry to reduce the simulation time and size.
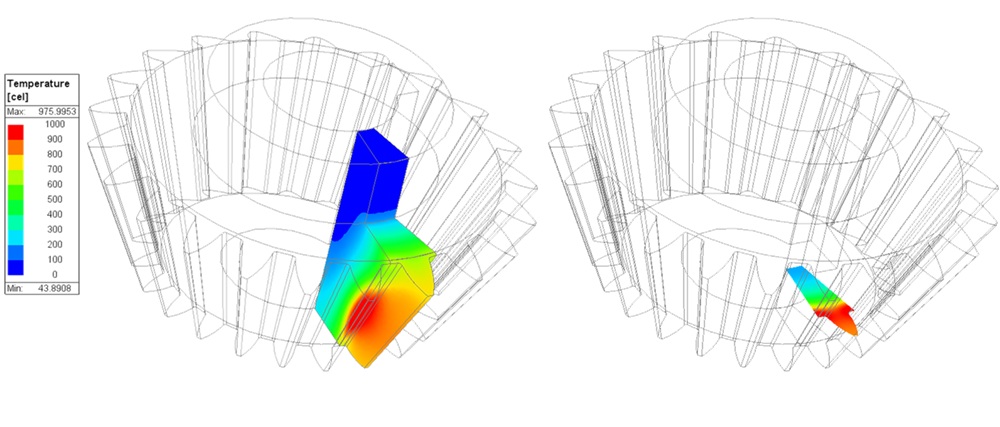
The image shows the temperature in a gear. The results show a poor heating pattern with higher heating at the root and center of the tooth, and under heating at the ends and the tooth. This is a result of a low frequency and a short coil.
Mastering Induction Heating Frequency Optimization With Simulation
Optimizing frequency in induction heating applications is essential for achieving precise heat distribution and efficiency. By understanding the skin effect, edge effect, and end effect, engineers can make informed decisions that enhance performance and improve overall process reliability. Simulation tools, like those from Ansys, enable detailed analysis of these frequency-dependent behaviors, ensuring successful induction heating frequency optimization strategies for real-world applications.
Optimize Your Induction Heating Process with Simulation
At SimuTech Group, we empower engineers with advanced simulation solutions to refine induction heating designs and optimize frequency selection. Whether you’re working on coil design, material properties, or power efficiency, our experts can help you achieve superior results.
Contact us today to explore how simulation-driven insights can enhance your engineering workflows and maximize performance!

Tareq Eddir, B.S.E. Chemical Engineering
Staff Engineer, SimuTech Group
Tareq has worked in the induction heating industry for over eight years with experience in simulating, optimizing, consulting, testing and troubleshooting induction heating applications. His work includes leading a host of interesting projects across various industries, including heat treatment, melting, shrink fitting, and much more. He has been a member of SimuTech Group’s low frequency electrical team since 2022, with interest in low frequency and thermal coupled simulations.