 Contact Us
Introduction to PSD Pressure
The introduction of Auto Spectrum PSD Pressure in Ansys Mechanical is a welcome enhancement for engineers performing pressure-driven random vibration analyses. Users can now define pressure Power Spectral Density (PSD) loads directly within the Random Vibration environment without relying on APDL command snippets simply to apply the loading.
For many applications, this capability may be all that is required.
However, a pressure PSD does not always fully characterize a pressure environment.
This distinction becomes particularly important when evaluating launch acoustics, aircraft turbulent boundary layers, propagating pressure waves, acoustic fatigue environments, and other spatially distributed pressure fields.
In these applications, the PSD provides a description of how pressure energy is distributed with frequency. What it does not necessarily describe is how pressure fluctuations at different locations are related to one another.
An important question naturally follows:
Does knowing the pressure PSD at one or more locations completely describe the pressure field acting on the structure?
In many applications, the answer is yes.
In others, the answer is no.
The difference lies in whether the pressure fluctuations at different locations interact in a way that influences the structural response.
A pressure PSD can tell us how much energy exists at a given frequency. What it cannot tell us is whether pressure fluctuations at different locations occur in unison, behave independently, or exhibit phase differences.
Those relationships may not matter for every application. However, in certain acoustic, aerodynamic, and flow-induced vibration environments, they can significantly influence the resulting vibration response and, ultimately, the fatigue predictions derived from that response.
To understand when a pressure PSD is sufficient and when additional cross-spectral information may be required, it is useful to examine exactly what information the PSD provides and what information it does not.
A Welcome Addition to Random Vibration in Mechanical
One of the most welcome enhancements in recent versions of Ansys Mechanical is the ability to define Auto Spectrum PSD Pressure directly within the Random Vibration environment.
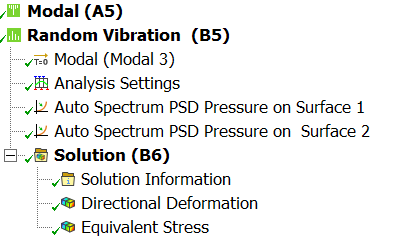
Auto Spectrum PSD Pressure can now be defined directly within the Random Vibration environment in Ansys Mechanical.
For engineers performing pressure-driven random vibration analyses, this capability represents a meaningful workflow improvement. Pressure PSDs can now be defined directly within the Mechanical interface, eliminating much of the APDL effort previously required to define random pressure excitation.
For many applications, this capability may provide everything needed to characterize the loading environment.
However, the introduction of this new capability naturally raises an important question:
Does a pressure PSD completely describe the pressure environment acting on the structure?
To answer that question, it is helpful to examine exactly what information a pressure PSD provides and what information may still be missing.
A Pressure PSD Doesn’t Tell the Whole Story
At its core, a pressure PSD describes how pressure energy is distributed with frequency. Mathematically, the PSD populates the diagonal terms of the pressure spectral matrix:
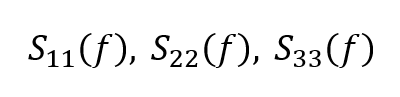
These terms represent the pressure auto-spectra and describe the spectral content of the excitation at individual locations.
For many random vibration applications, this information may be entirely sufficient.
However, many pressure environments encountered in aerospace applications are inherently spatial in nature. Launch acoustics, turbulent boundary layers, wind loading, and flow-induced pressure fields do not act at isolated points on a structure. Instead, pressure fluctuations develop over extended surfaces and evolve differently from one location to another.
Consider two pressure transducers mounted on an aircraft skin panel. Even if both locations exhibit identical PSDs, an important question remains unanswered.
The PSD tells us how much excitation energy exists at each location and how that energy varies with frequency. What it does not describe is the relationship between the pressure fluctuations measured at those locations.
The pressure fluctuations may occur nearly in phase across the structure. They may be only partially correlated. They may exhibit phase delays associated with wave propagation or convective transport. They may even behave independently of one another.
These differences are not reflected in the PSD itself.
As a result, two pressure environments can possess identical PSDs while producing markedly different structural responses. Although the spectral content of the excitation may be the same, the way pressure fluctuations interact across the structure can significantly influence how vibrational energy is transmitted into the system.
The PSD therefore describes only part of the loading environment. It quantifies the spectral content of the excitation at individual locations, but it does not describe how those locations interact with one another.
In many applications, that distinction may have little impact on the solution. In others, particularly those involving spatially distributed pressure fields, it can directly influence predicted displacement levels, stress distributions, and ultimately fatigue life.
Understanding those relationships becomes important whenever the response depends not only on the pressure level itself, but also on how the pressure field behaves across the structure.
That additional information is contained in the cross-spectrum.
What Happens Between Measurement Locations?
The missing information is captured by the cross-spectrum.
While the pressure PSD describes the spectral content of the excitation at an individual location, the cross-spectrum describes the relationship between pressure fluctuations occurring at different locations.
In Mechanical APDL, this relationship is represented through the cross-spectrum:

where Cnm represents the co-spectrum, or real component of the relationship, and Qnm represents the quadrature spectrum, or imaginary component.
Together, these quantities describe the interaction between pressure fluctuations occurring at different locations.
In some applications, those interactions may have little influence on the solution. In others, they may play an important role in determining how vibrational energy is transmitted into the structure and how the structure responds to the loading environment.
The importance of the cross-spectrum becomes easier to appreciate when considering that not all pressure environments behave in the same way. Some pressure fields remain highly correlated over large distances, while others become progressively less correlated as separation distance increases. In certain environments, phase relationships between pressure fluctuations can also become important.
Understanding those differences becomes easier when we examine how several common pressure environments behave.
Not All Pressure Fields Behave the Same
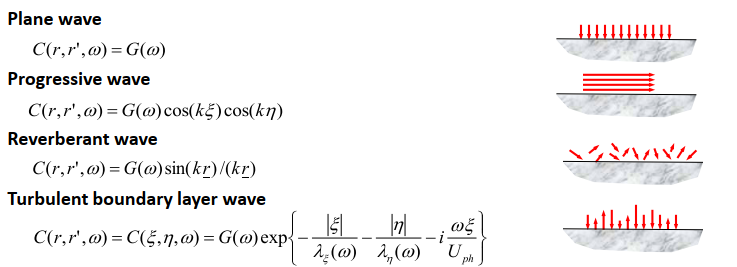
Representative correlation models for several common pressure environments. Although pressure levels may appear similar, the spatial relationship between pressure fluctuations can vary significantly depending on the nature of the field of excitation. Adapted from Ansys LS-DYNA Random Vibration training material.
At this point, it becomes easier to see why a pressure PSD may not always tell the entire story.
Different pressure environments can exhibit fundamentally different spatial behavior, even when the pressure levels at individual measurement locations appear similar.
A plane wave, for example, remains highly correlated across a structure. Pressure fluctuations occurring at one location closely resemble those occurring elsewhere in the field.
A reverberant acoustic field behaves differently. As the distance between measurement locations increases, the correlation gradually decreases. Locations that are close together may experience similar pressure fluctuations, while locations farther apart become progressively less related.
Turbulent boundary layer environments introduce additional complexity. In addition to correlation decay, the pressure field is influenced by convection effects associated with the flow direction. As a result, pressure fluctuations measured at different locations may exhibit both correlation and phase differences.
Although these environments may produce similar pressure PSDs at individual locations, they do not necessarily represent the same loading condition.
The pressure levels may be comparable. The resulting structural vibration responses may not.
This observation helps explain why pressure fields that appear similar when viewed only through a PSD can produce markedly different vibration responses. The difference lies not in the amount of energy present, but in how pressure fluctuations are related across the structure.
For some applications, that distinction may have little influence on the results. For others, it can become an important factor in accurately characterizing the excitation and predicting the resulting structural response.
Among these examples, the turbulent boundary layer model deserves particular attention because it provides insight into an aspect of cross-spectral loading that is often overlooked: phase relationships.
Why QDVAL Exists
Most engineers can appreciate why pressure fluctuations occurring at different locations may be correlated.
What is often less intuitive is that those relationships can also contain phase information.
A useful clue appears in the turbulent boundary layer model shown in the previous figure. Unlike the other examples, the expression contains the term
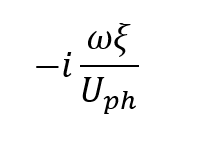
The significance of this term lies not in the mathematical expression itself, but in the physical behavior that it represents.
Pressure disturbances within a turbulent boundary layer do not simply fluctuate in place. They are convected downstream by the flow. As those disturbances move across the surface, pressure fluctuations measured at one location may lag those measured at another location.
In other words, the relationship between the two signals contains both amplitude and phase information associated with the propagation of the pressure disturbance.
That observation provides a useful way to think about the cross-spectrum.
Some loading environments can be described adequately using only the real component of the cross-spectrum. Others require both real and imaginary components to fully characterize the pressure field.
This is precisely why Mechanical APDL provides two separate commands for defining cross-spectral terms:
- COVAL, which defines the co-spectrum or real component.
- QDVAL, which defines the quadrature spectrum or imaginary component.
For many users, the presence of QDVAL may seem unusual at first. However, once phase relationships are recognized as part of the loading environment, its purpose becomes much easier to understand.
At this point, readers familiar with vibration testing often ask a natural question:
If phase relationships are important, isn’t that information already contained in coherence?
To answer that, it is worth taking a closer look at how coherence is actually defined.
Most Engineers Already Know Coherence
Even engineers who have never worked with cross-spectral loading have likely encountered coherence during vibration or acoustic testing.
Coherence is commonly reported by spectrum analyzers and data acquisition software alongside quantities such as PSDs and transfer functions. As a result, many engineers are familiar with it as a measure of how strongly two signals are related.
In practice, coherence is often used as a data quality indicator.
High coherence generally increases confidence that the measured output is strongly related to the measured input. Low coherence may suggest the presence of noise, additional excitation sources, nonlinearities, or other effects that complicate the measurement.
Because coherence is so commonly reported during testing, it is natural to assume that it completely describes the relationship between two signals.
However, coherence and cross-spectrum are not the same thing.
In fact, understanding the relationship between the two helps explain why a coherence function alone may not always provide all of the information required to characterize a pressure field.
A Useful Observation About Coherence
According to the Ansys documentation, coherence is defined as
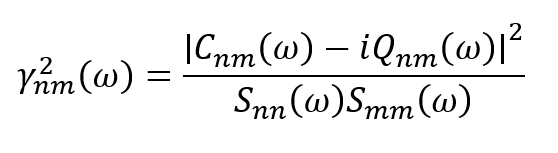
Ansys defines coherence using the co-spectrum and quadrature spectrum.
An important observation can immediately be made from this expression.
The coherence function is calculated from the co-spectrum and quadrature spectrum.
In other words:
Not the other way around.
Because coherence is formed from the magnitude of a complex quantity, it does not preserve the complete relationship between two signals. As a result, phase information contained in the original cross-spectrum is not explicitly retained.
From an engineering perspective, this means that coherence may indicate how strongly two signals are related, but it does not necessarily provide a complete description of that relationship.
The distinction is particularly important when phase relationships become significant.
A coherence function alone does not necessarily describe:
- Propagation effects
- Convective delays
- Phase relationships between locations
- The sign of the imaginary component of the cross-spectrum
For many applications, this may not matter.
For others, particularly those involving spatially distributed pressure fields, it can become an important consideration when constructing a representative loading environment for simulation.
Before You Start Your Simulation, Ask One More Question
Simulation engineers are often provided with PSDs and coherence functions and assume that the loading environment has been fully characterized.
In many applications, that assumption may be perfectly valid.
In others, it may be worth asking one additional question:
Is the cross-spectrum available?
When available, cross-spectral information can provide a richer description of the pressure field than coherence alone.
For analysts working with measured acoustic environments, turbulent boundary layers, or flow-induced pressure fields, understanding whether this information exists can be just as important as understanding the pressure levels themselves.
When the Pressure Field Requires More Than a PSD
Up to this point, the discussion has focused on the physical behavior of the pressure field and why a pressure PSD may not always provide a complete description of the loading environment.
The next question is a practical one:
What happens when the pressure field must be described using cross-spectral information?
For loading environments that can be adequately characterized by a pressure PSD alone, the newly introduced Auto Spectrum PSD Pressure capability may provide everything required to define the excitation within Mechanical.
However, some pressure environments require more than a PSD.
When the loading environment must account for the relationships between pressure fluctuations occurring at different locations, analysts may need to move beyond the Mechanical interface and represent the pressure field using Mechanical APDL command snippets.
A useful way to visualize this is through the pressure spectral matrix.
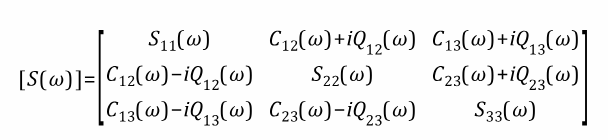
Example of a pressure spectral matrix. The diagonal terms represent the pressure auto-spectra, while the off-diagonal terms describe the relationships between pressure fluctuations occurring at different locations.
The diagonal terms contain the pressure auto-spectra and describe the spectral content of the excitation at individual locations.
The off-diagonal terms contain the cross-spectral relationships between locations.
Together, these terms define the pressure field acting on the structure.
For a pressure-PSD-only description, the diagonal terms may be sufficient.
When spatial correlation becomes important, however, the off-diagonal terms may also need to be defined.
At that point, analysts generally transition to Mechanical APDL implementations that allow the complete spectral matrix to be represented.
When a cross-spectral representation of the pressure field is required, Mechanical APDL provides the commands needed to define both the auto-spectral and cross-spectral terms of the matrix:
- PSDVAL, which defines the auto-spectral terms.
- COVAL, which defines the real component of the cross-spectrum.
- QDVAL, which defines the imaginary component of the cross-spectrum.
Together,
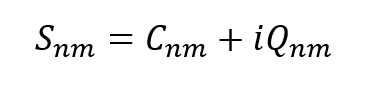
define the complete cross-spectrum and allow the loading environment to be represented in a way that extends beyond a pressure-PSD-only description.
Where Do You Start?
At this point, a practical question naturally arises:
If cross-spectral information is required, where do you start?
A useful starting point is Ansys APDL Verification Problem VM298: PSD Analysis of a 40-Story Building Under Wind Load Excitation. Although the benchmark addresses wind loading rather than acoustics, it provides a practical framework for understanding how Ansys constructs a correlated random loading environment using both auto-spectral and cross-spectral terms.
In particular, the example demonstrates:
- Spectral matrix construction
- PSDVAL usage
- COVAL usage
- Distance-dependent correlation
For analysts developing Mechanical APDL command snippets, Ansys APDL Verification Problem VM298 provides valuable guidance and serves as a useful reference for organizing cross-spectral loading definitions.
What VM298 Does Not Show
A careful review of VM298 reveals that the example utilizes PSDVAL and COVAL but does not utilize QDVAL.
This is not because QDVAL is unnecessary. Rather, the wind-loading model employed in the benchmark produces a purely real-valued cross-spectrum.
For some applications, that may be sufficient. Other pressure environments may contain phase relationships between measurement locations, requiring both the real and imaginary components of the cross-spectrum to fully characterize the loading environment. In those situations, COVAL defines the real component of the cross-spectrum, while QDVAL defines the imaginary component.
This distinction highlights an important limitation of using VM298 as a template. The example provides an excellent introduction to correlated loading implementations, but it should not be interpreted as a complete representation of every cross-spectral loading scenario.
The real value of VM298 is not that it provides a solution for every application. Its value lies in demonstrating how a validated Ansys APDL implementation organizes and constructs a correlated loading environment. For analysts developing Mechanical APDL command snippets, it provides a practical starting point while illustrating the overall structure of a cross-spectral implementation.
As with any verification problem, the analyst must determine whether the assumptions embedded in the benchmark are appropriate for the loading environment being modeled. In some cases, a purely real-valued cross-spectrum may be sufficient. In others, particularly when propagation effects, convection, or phase relationships are present, a more complete cross-spectral description may be required.
Is a Pressure PSD Enough for Your Analysis?
The introduction of Auto Spectrum PSD Pressure in Ansys Mechanical is a significant enhancement for engineers performing pressure-driven random vibration analyses.
For many applications, the new capability simplifies model setup and may provide everything required to characterize the loading environment.
However, not all pressure fields are completely described by their PSDs.
When spatial correlation, propagation effects, or phase relationships become important, the pressure field may require a more complete description than a pressure PSD alone can provide.
The purpose of this article is not to suggest that every random vibration analysis requires a cross-spectrum.
Rather, it is to highlight an important distinction:
Understanding when that distinction matters can help analysts select an appropriate level of modeling fidelity, better interpret measured data, and make more informed decisions when evaluating vibration response, stress predictions, and fatigue performance.
Ultimately, the question is not whether a pressure PSD is correct.
The question is whether a pressure PSD alone is sufficient for the pressure environment being modeled.
Need help evaluating pressure-driven random vibration in Ansys?
SimuTech Group can help you determine whether a pressure PSD is sufficient for your application, assess when cross-spectral information may be needed, and develop an appropriate simulation approach in Ansys Mechanical or Mechanical APDL.
Talk with a SimuTech engineer about your application.

Balaji Benjamin, Ph.D., Mechanical Engineering
Senior Staff Engineer, SimuTech Group
With 13 years at SimuTech Group and more than 20 years of experience in NVH simulation and testing, Balaji supports customers across vibration and acoustics workflows, including noise source evaluation, correlation to test data, and performance-driven design refinement. He holds a Ph.D. in Mechanical Engineering from the State University of New York at Binghamton.